Information Technology Services (ITS)
ITS Preparedness infographics: reflect critical services
Published on: March 31, 2020
The COVID-19 pandemic has resulted in a large migration of the University of Toronto (U of T) community towards a remote working environment.
Helping students, staff and faculty through this technological transition is Information Technology Services (ITS). ITS staff is providing critical resources and services across the tri-campus community, including the creation of a central online hub for this information called ITS Preparedness.
To illustrate the work, demand and response of the ITS department, please review our infographics here, which also exemplify the IT@UofT Strategic Plan.
Infographic #1: IT@UofT People
Infographic #2: IT@UofT Collaboration
Infographic #3: IT@UofT Solutions
Caption for infographics
Infographics #1: IT@UofT People
Note: Statistics presented are approximate and subject to change.
ITS Preparedness
A look at the University of Toronto’s Information Technology Services (ITS) response, usages and resources during COVID-19.
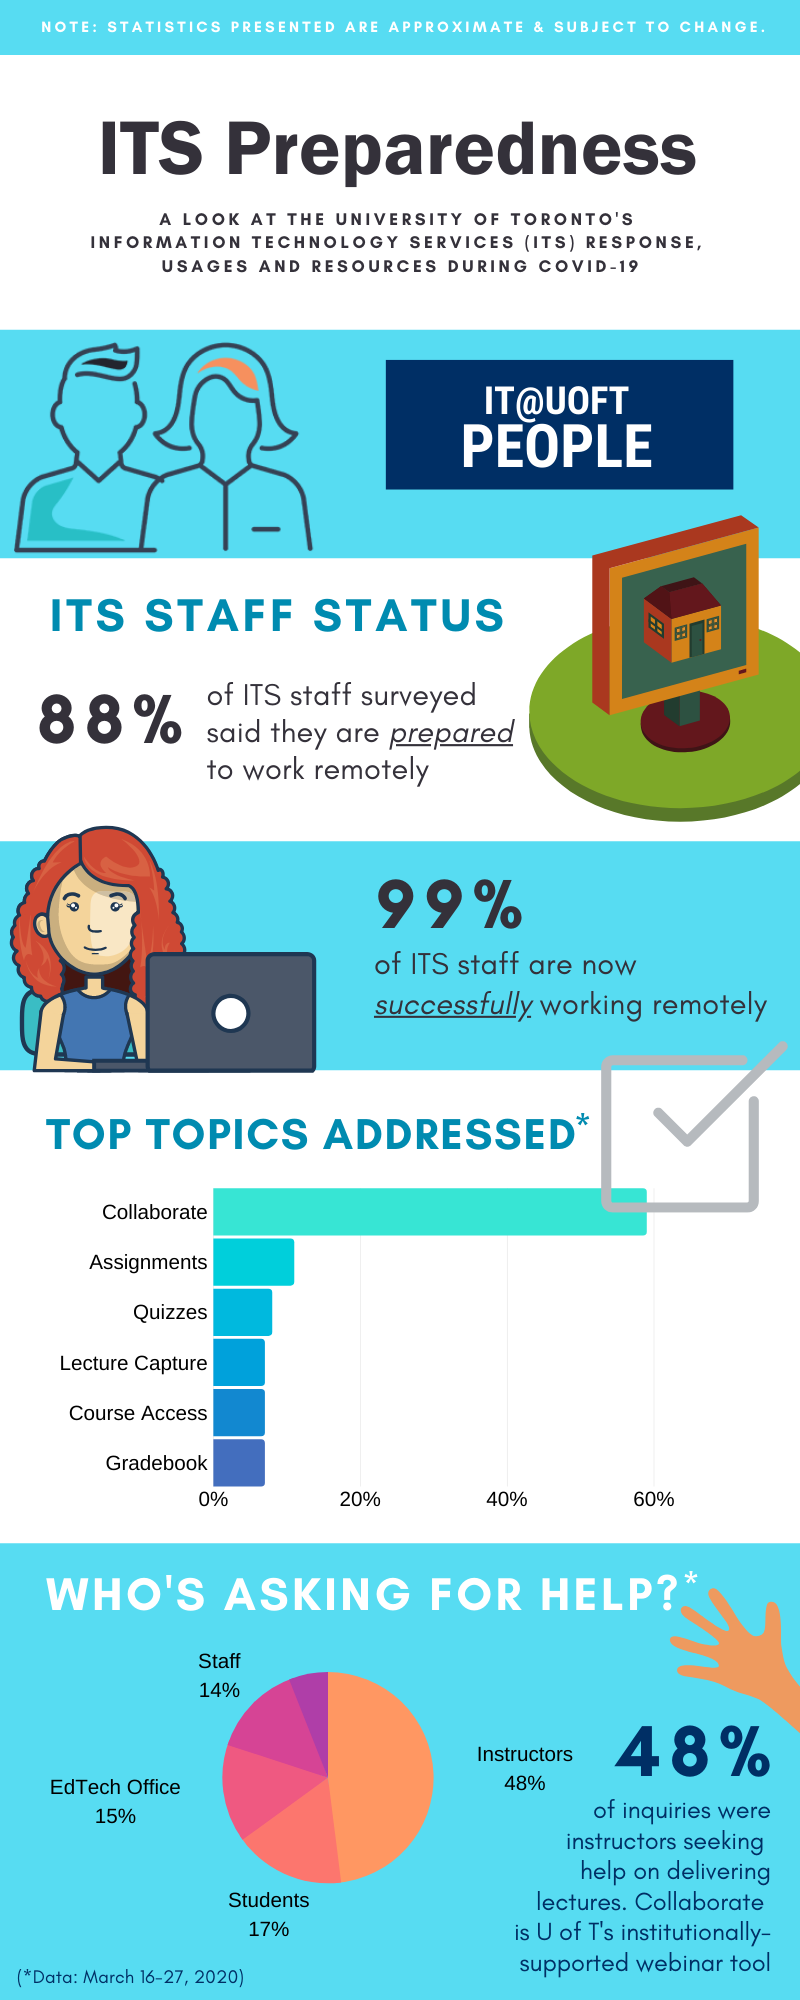
ITS staff status
- 88% of ITS staff surveyed said they are prepared to work remotely.
- 99% of ITS staff are now successfully working remotely.
Top topics addressed*
- Collaborate
- Assignments
- Quizzes
- Lecture Capture
- Course Access
- Gradebook
Who’s asking for help?
48% of inquiries were instructors seeking help on delivering lectures. Collaborate is U of T’s institutionally supported webinar tool.
- Instructors (48%)
- Students (17%)
- EdTech Office (15%)
- Staff (14%)
*Data: March 16-27, 2020.
Infographics #2: IT@UofT Collaboration
Note: Statistics presented are approximate and subject to change.
ITS Preparedness
A look at the University of Toronto’s Information Technology Services (ITS) response, usages and resources during COVID-19.
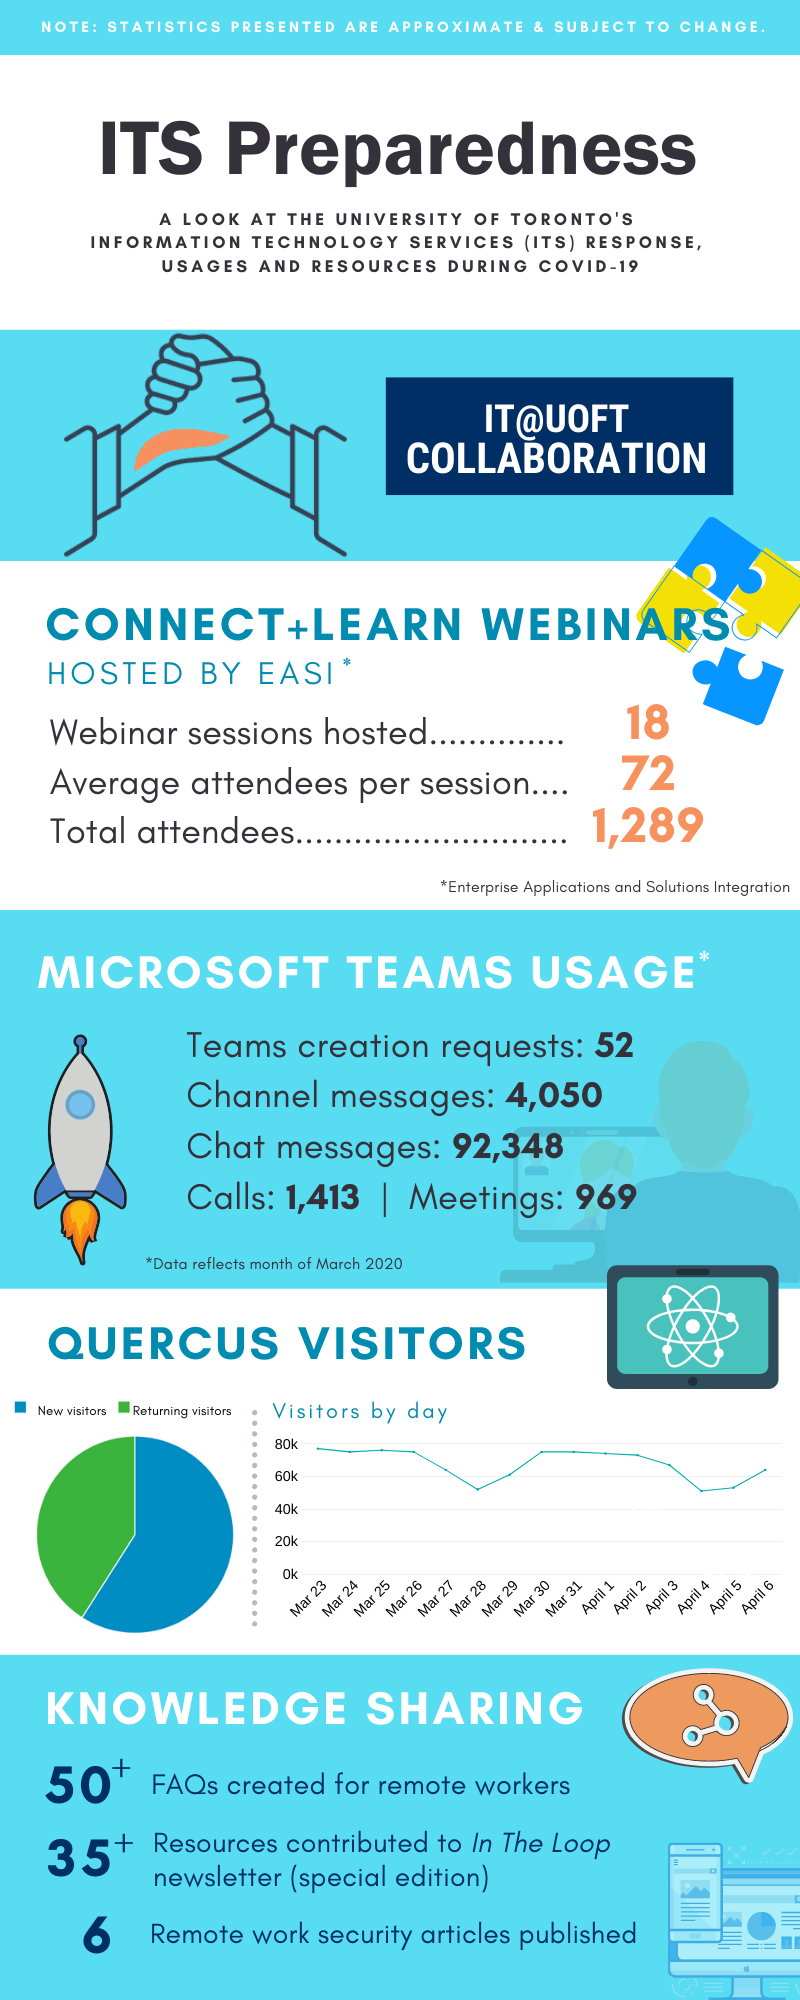
Connect+Learn webinars
Hosted by EASI (Enterprise Applications and Solutions Integration)
- Webinar sessions hosted: 18
- Average attendees per session: 72
- Total attendees: 1,289
Microsoft Teams usage*
- Teams creation requests: 52
- Channel messages: 4,050
- Chat messages: 92,348
- Calls: 1,413
- Meetings: 969
* Data reflects month of March 2020
Knowledge sharing
- 50+ FAQs created for remote workers
- 35+ resources contributed in In the Loop newsletter (special edition)
- 6 remote work security articles published
Infographics #3: IT@UofT Solutions
Note: Statistics presented are approximate and subject to change.
ITS Preparedness
A look at the University of Toronto’s Information Technology Services (ITS) response, usages and resources during COVID-19.
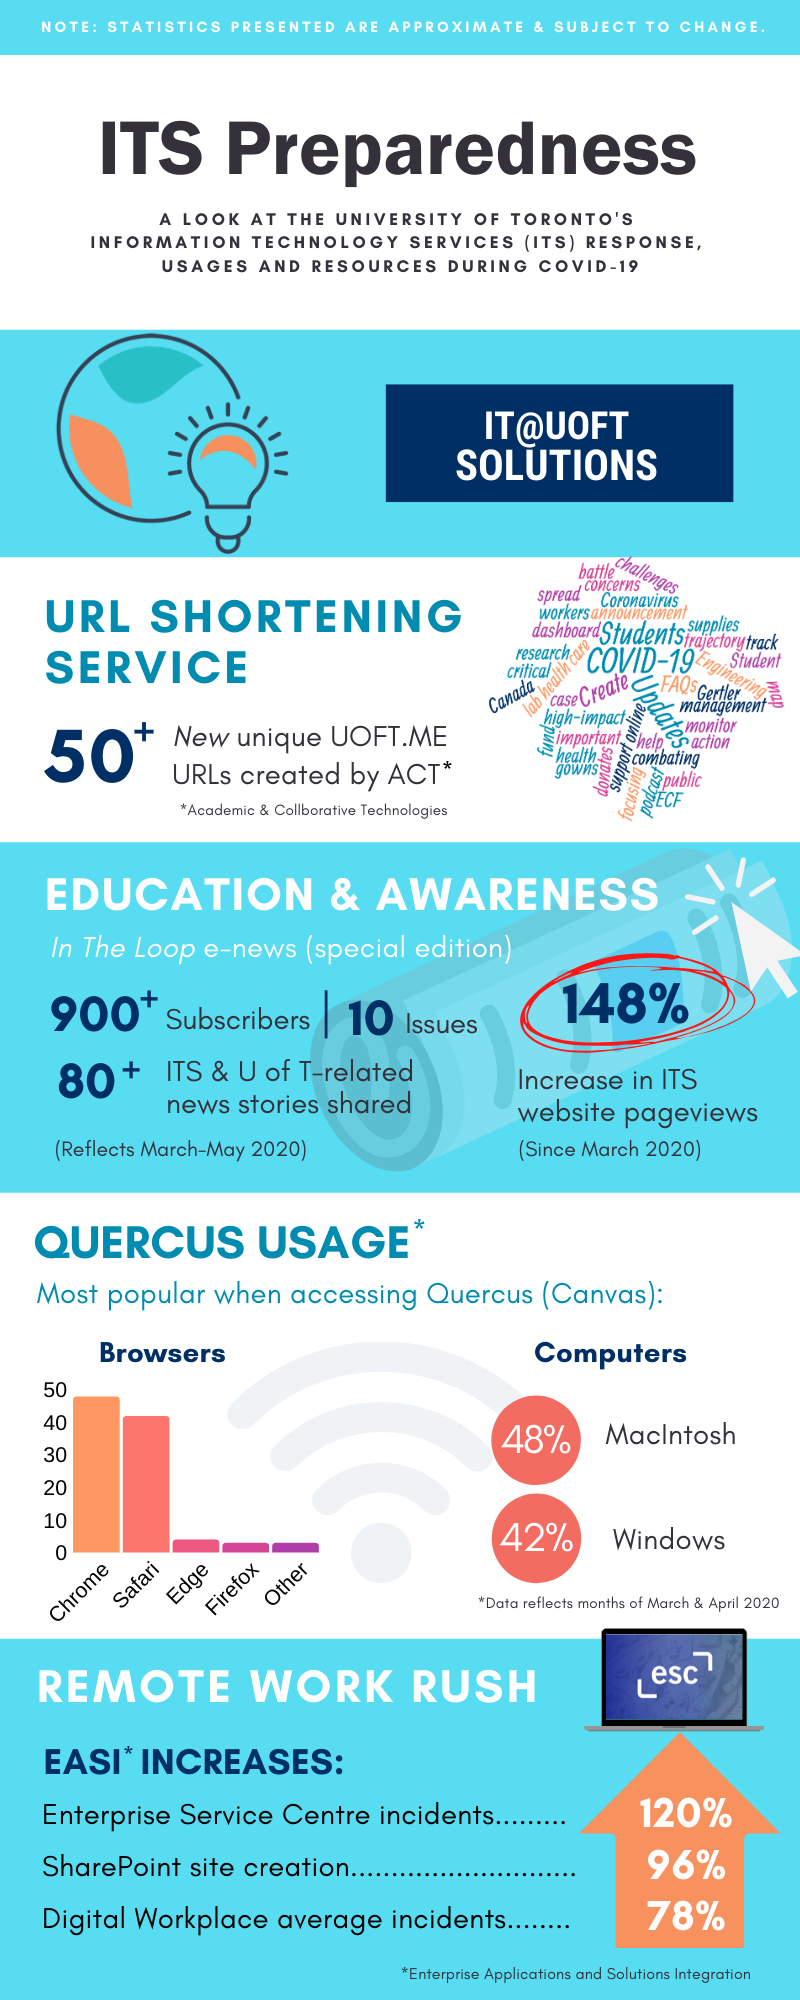
URL shortening services
50+ new unique uoft.me URLs created by ACT (Academic & Collaborative Technologies)
Education & Awareness
In the Loop e-news (special edition)
- 900+ subscribers
- 10 issues
- 80+ ITS & U of T related news stories shared
(Reflects March to May 2020)
148% increased in ITS website page views (Since March 2020)
Quercus usage*
Most popular when accessing Quercus (Canvas):
- Chrome
- Safari
- Edge
- Firefox
- Other
- MacIntosh (48%)
- Windows (42%)
* Data reflects months of March & April 2020)
Remote work rush
EASI (Enterprise Applications and Solutions Integration) increases:
- Enterprise Services Centre incidents (120%)
- SharePoint site creation (96%)
- Digital Workplace average incidents (78%)